Home > Topdrawer > Statistics > Good teaching > Data reduction > Box plots
Box plots
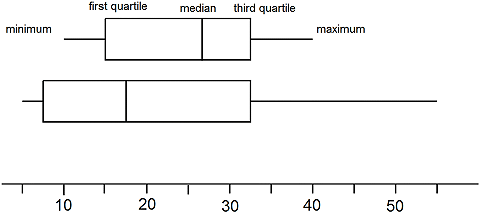
Box plots provide a five-number summary for a data set. They include:
- the median, which has equal numbers of ordered observations on each side of it
- the first and third quartiles divide the halves of the ordered data set into halves again
- the overall range of the data from minimum to maximum provides information about the spread of the whole data set.
The interquartile range (IQR) represents the middle 50% of the data. The IQR extends from the first quartile to the third quartile.
Box plots are most useful for representing the spread of large sets of data, but provide no information on the number of observations represented. They can also be used to compare multiple data sets.
The article Box Plots in the Australian Curriculum provides an introduction to box plots and to contexts within which their use can be meaningful.
Predicting AFL winners
This investigation uses side-by-side box plots to predict Australian Football League winners based on their past scoring performances.

